> ## Documentation Index
> Fetch the complete documentation index at: https://www.propeldata.com/llms.txt
> Use this file to discover all available pages before exploring further.
# Embeddable UI
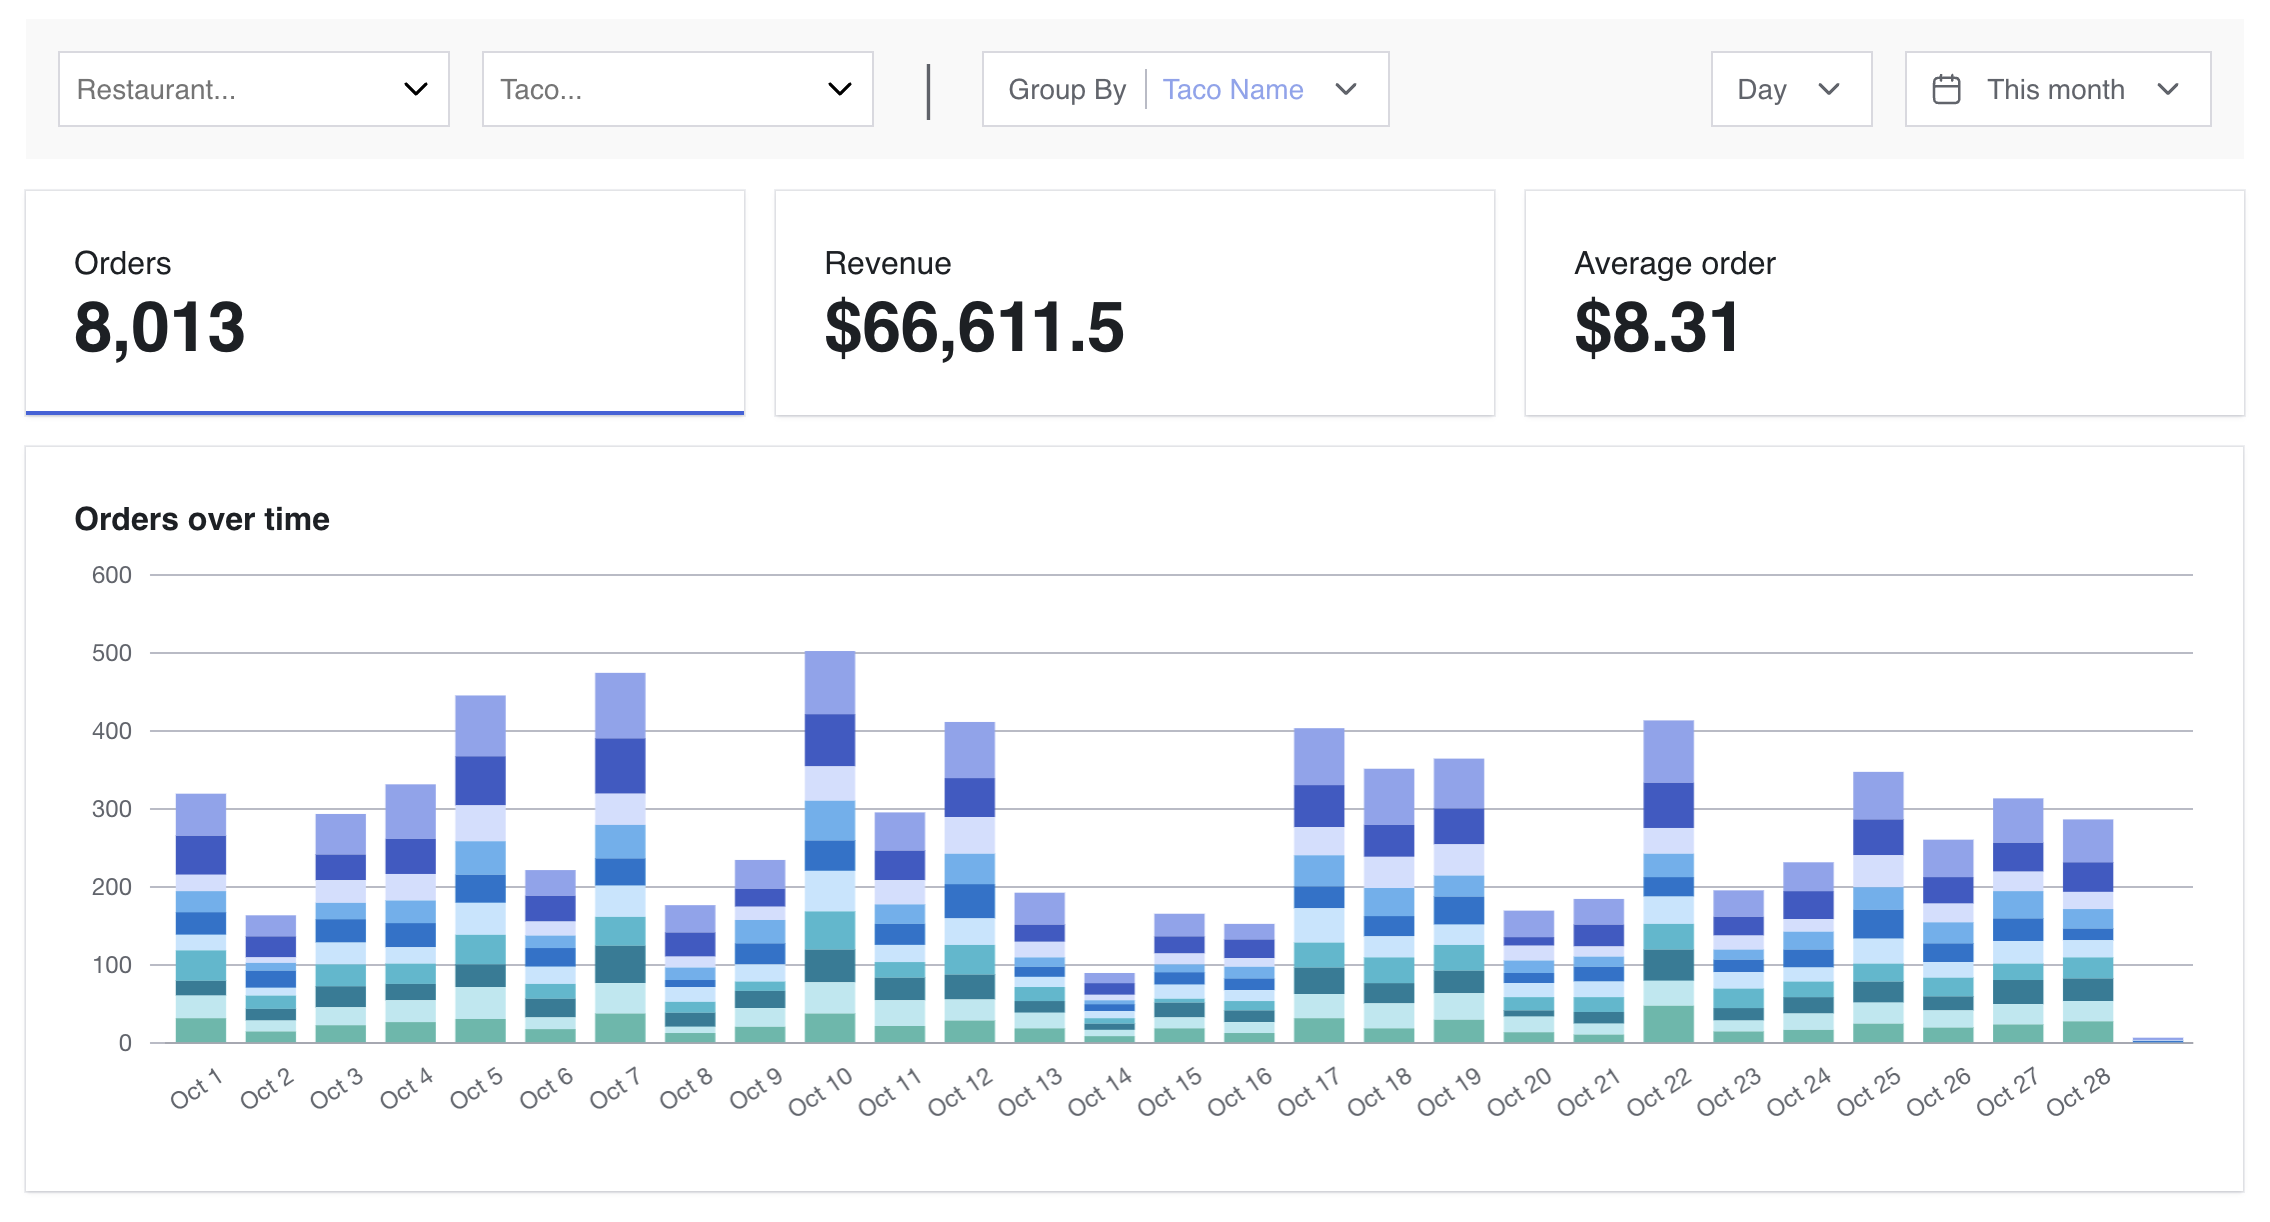
> Build custom dashboards insanely fast.
An open-source React library to build dashboards and data apps with a few lines of code.
 ## Install
Install the package from your command line.
```shell npm theme={"system"}
npm install @propeldata/ui-kit
```
```shell yarn theme={"system"}
yarn add @propeldata/ui-kit
```
Add `ThemeProvider` to your application, wrapping the root component inside of `body`.
```jsx {7,9} theme={"system"}
import { ThemeProvider } from "@propeldata/ui-kit";
export default function () {
return (
);
}
```
## Components
### Visualizations
Visualize time-series data.
Visualize a single value.
Visualize records in table format.
Display ranked aggregate data.
Show part-to-whole relationships.
### Inputs
Select date ranges for analysis.
Filter data using a dropdown.
Choose a time granularity for aggregation.
Break down data by dimensions.
### Providers
Manage authentication across components.
Customize the look and feel of components.
Applies filters to child components.
### Query Hooks
Query hooks fetch data from the Query APIs from your frontend application. They are designed to work with any 3rd-party charting library such as Echarts, Chart.js, or D3.js.
Query data using SQL.
Fetch a single aggregated value from the Counter API.
Fetch tabular data from the Data Grid API.
Fetch ranked data from the Leaderboard API.
Fetch time-series data from the Time Series API.
Fetch top values from the Top Values API.
## Install
Install the package from your command line.
```shell npm theme={"system"}
npm install @propeldata/ui-kit
```
```shell yarn theme={"system"}
yarn add @propeldata/ui-kit
```
Add `ThemeProvider` to your application, wrapping the root component inside of `body`.
```jsx {7,9} theme={"system"}
import { ThemeProvider } from "@propeldata/ui-kit";
export default function () {
return (
);
}
```
## Components
### Visualizations
Visualize time-series data.
Visualize a single value.
Visualize records in table format.
Display ranked aggregate data.
Show part-to-whole relationships.
### Inputs
Select date ranges for analysis.
Filter data using a dropdown.
Choose a time granularity for aggregation.
Break down data by dimensions.
### Providers
Manage authentication across components.
Customize the look and feel of components.
Applies filters to child components.
### Query Hooks
Query hooks fetch data from the Query APIs from your frontend application. They are designed to work with any 3rd-party charting library such as Echarts, Chart.js, or D3.js.
Query data using SQL.
Fetch a single aggregated value from the Counter API.
Fetch tabular data from the Data Grid API.
Fetch ranked data from the Leaderboard API.
Fetch time-series data from the Time Series API.
Fetch top values from the Top Values API.