

Use cases
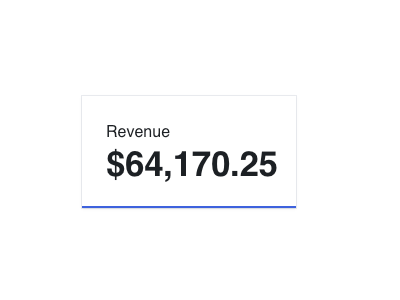
KPI visualization
Visualize key performance indicators.
In-product metrics
Display metrics within your product.
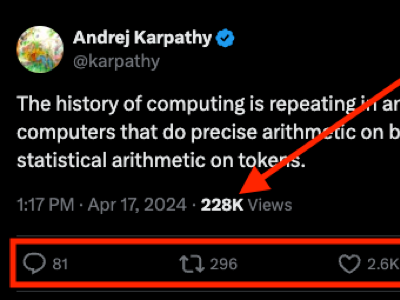
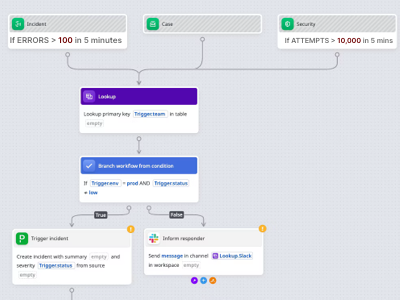
Alerts and triggers
Power alerts and automated workflows.
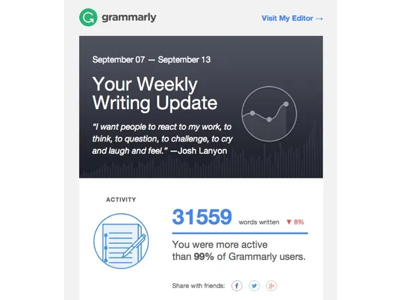
Product usage emails
Send key metrics via email.
Features
All the common API features.Example
Example 1: Simple counter query
Get the total taco sales for the last year, filtered by the restaurant name.query CounterExample1 {
counter(input: {
metric: {
sum: {
dataPool: {
name: "TacoSoft Demo Data"
},
measure: {
columnName: "taco_total_price"
}
}
},
timeRange: {
relative: LAST_N_YEARS,
n: 1
},
filterSql: "restaurant_name = 'El Buen Sabor'"
}) {
value
}
}
{
  "counter": {
    "value": "258959.5"
  }
}
Usage
Arguments
The fields for querying a Metric in counter format. A Metric’s counter query returns a single value over a given time range.MetricInput
The Metric to query. You can query a pre-configured Metric by ID or name, or you can query an ad hoc Metric that you define inline.
Show MetricInput
Show MetricInput
ID
The ID of a pre-configured Metric.
String
The name of a pre-configured Metric.
CustomMetricQueryInput
CountMetricQueryInput
SumMetricQueryInput
An ad hoc Sum Metric.
Show SumMetricQueryInput
Show SumMetricQueryInput
DataPoolInput
required
AverageMetricQueryInput
An ad hoc Average Metric.
Show AverageMetricQueryInput
Show AverageMetricQueryInput
DataPoolInput
required
MinMetricQueryInput
An ad hoc Min Metric.
Show MinMetricQueryInput
Show MinMetricQueryInput
DataPoolInput
required
MaxMetricQueryInput
An ad hoc Max Metric.
Show MaxMetricQueryInput
Show MaxMetricQueryInput
DataPoolInput
required
CountDistinctMetricQueryInput
An ad hoc Count Distinct Metric.
Show CountDistinctMetricQueryInput
Show CountDistinctMetricQueryInput
DataPoolInput
required
TimeRangeInput
The time range for calculating the counter.
Show TimeRangeInput
Show TimeRangeInput
The fields required to specify the time range for a time series, counter, or leaderboard Metric query.If no relative or absolute time ranges are provided, Propel defaults to an absolute time range beginning with the earliest record in the Metric’s Data Pool and ending with the latest record.If both relative and absolute time ranges are provided, the relative time range will take precedence.If a
LAST_N relative time period is selected, an n ≥ 1 must be provided. If no n is provided or n < 1, a BAD_REQUEST error will be returned.String
The timestamp field to use when querying. Defaults to the timestamp configured on the Data Pool or Metric, if any.
Set this to filter on an alternative timestamp field.
RelativeTimeRange
The relative time period.
Show RelativeTimeRange
Show RelativeTimeRange
The Relative time ranges are based on the current date and time.
THIS - The current unit of time. For example, if today is June 8, 2022, and
THIS_MONTH is selected, then data for June 2022 would be returned.PREVIOUS - The previous unit of time. For example, if today is June 8, 2022, and
PREVIOUS_MONTH is selected, then data for May 2022 would be returned. It excludes
the current unit of time.NEXT - The next unit of time. For example, if today is June 8, 2022, and
NEXT_MONTH is selected, then data for July 2022 would be returned. It excludes
the current unit of time.LAST_N - The last n units of time, including the current one. For example, if today
is June 8, 2022 and LAST_N_YEARS with n = 3 is selected, then data for 2020, 2021, and
2022 will be returned. It will include the current time period.THIS_HOUR: Starts at the zeroth minute of the current hour and continues for 60 minutes.TODAY: Starts at 12:00:00 AM of the current day and continues for 24 hours.THIS_WEEK: Starts on Monday, 12:00:00 AM of the current week and continues for seven days.THIS_MONTH: Starts at 12:00:00 AM on the first day of the current month and continues for the duration of the month.THIS_QUARTER: Starts at 12:00:00 AM on the first day of the current calendar quarter and continues for the duration of the quarter.THIS_YEAR: Starts on January 1st, 12:00:00 AM of the current year and continues for the duration of the year.PREVIOUS_HOUR: Starts at the zeroth minute of the previous hour and continues for 60 minutes.YESTERDAY: Starts at 12:00:00 AM on the day before the today and continues for 24 hours.PREVIOUS_WEEK: Starts on Monday, 12:00:00 AM, a week before the current week, and continues for seven days.PREVIOUS_MONTH: Starts at 12:00:00 AM on the first day of the month before the current month and continues for the duration of the month.PREVIOUS_QUARTER: Starts at 12:00:00 AM on the first day of the calendar quarter before the current quarter and continues for the duration of the quarter.PREVIOUS_YEAR: Starts on January 1st, 12:00:00 AM, the year before the current year, and continues for the duration of the year.NEXT_HOUR: Starts at the zeroth minute of the next hour and continues for 60 minutes.TOMORROW: ” Starts at 12:00:00 AM, the day after the current day, and continues for 24 hours.NEXT_WEEK: Starts on Monday, 12:00:00 AM, the week after the current week, and continues for the duration of the week.NEXT_MONTH: Starts at 12:00:00 AM on the first day of the next month and continues for the duration of the month.NEXT_QUARTER: Starts at 12:00:00 AM on the first day of the next calendar quarter and continues for the duration of the quarter.NEXT_YEAR: Starts on January 1st, 12:00:00 AM of the next year and continues for the duration of the year.LAST_N_MINUTES: Starts at the zeroth secondn- 1 minute(s) before the current minute and continues through the current minute. It includes this minute.LAST_N_HOURS: Starts at the zeroth minute of then- 1 hour(s) before the current hour, and continues through the current hour. It includes this hour.LAST_N_DAYS: Starts at 12:00:00 AM,n- 1 day(s) before the current day, and continues through the current day. It includes today.LAST_N_WEEKS: Starts on Monday, 12:00:00 AM,n- 1 week(s) before the current week, and continues through the current week. It includes this week.LAST_N_MONTHS: Starts at 12:00:00 AM on the first day of the month,n- 1 month(s) before the current month, and continues through the current month. It includes this month.LAST_N_QUARTERS: Starts at 12:00:00 AM on the first day of the calendar quartern- 1 quarter(s) before the current quarter and continues through the current quarter. It includes this quarter.LAST_N_YEARS: Starts on January 1st, 12:00:00 AM of the yearn- 1 year(s) before the current year and continues through the current year. It includes this year.LAST_15_MINUTESLAST_30_MINUTESLAST_HOURLAST_4_HOURSLAST_12_HOURSLAST_24_HOURSLAST_7_DAYSLAST_30_DAYSLAST_90_DAYSLAST_3_MONTHSLAST_6_MONTHSLAST_YEARLAST_2_YEARSLAST_5_YEARS
Int
The number of time units for the
LAST_N relative periods.DateTime
The optional start timestamp (inclusive). Defaults to the timestamp of the earliest record in the Data Pool.
DateTime
The optional end timestamp (exclusive). Defaults to the timestamp of the latest record in the Data Pool.
String
The time zone to use. Dates and times are always returned in UTC, but setting the time zone influences relative time ranges and granularities.You can set this to “America/Los_Angeles”, “Europe/Berlin”, or any other value in the IANA time zone database. Defaults to “UTC”.
String
The Query Filters to apply before retrieving the counter data, in the form of SQL. If no Query Filters are provided, all data is included.
Show Deprecated Fields
Show Deprecated Fields
ID
deprecated
The ID of the Metric to query.Required if
metricName is not specified.deprecated: Use metricString
deprecated
The name of the Metric to query.Required if
metricId is not specified.deprecated: Use metric[FilterInput!]
deprecated
The Query Filters to apply before retrieving the counter data. If no Query Filters are provided, all data is included.deprecated: Use
filterSql insteadShow FilterInput
Show FilterInput
The fields of a filter.You can construct more complex filters using you could writeNote that
and and or. For example, to construct a filter equivalent to(value > 0 AND value <= 100) OR status = "confirmed"
{
  "column": "value",
  "operator": "GREATER_THAN",
  "value": "0",
  "and": [{
    "column": "value",
    "operator": "LESS_THAN_OR_EQUAL_TO",
    "value": "0"
  }],
  "or": [{
    "column": "status",
    "operator": "EQUALS",
    "value": "confirmed"
  }]
}
and takes precedence over or.String
required
The name of the column to filter on.
FilterOperator
required
The operation to perform when comparing the column and filter values.
Show FilterOperator
Show FilterOperator
The available Filter operators.
EQUALS: Selects values that are equal to the specified value.NOT_EQUALS: Selects values that are not equal to the specified value.GREATER_THAN: Selects values that are greater than the specified value.GREATER_THAN_OR_EQUAL_TO: Selects values that are greater or equal to the specified value.LESS_THAN: Selects values that are less than the specified value.LESS_THAN_OR_EQUAL_TO: Selects values that are less or equal to the specified value.IS_NULL: Selects values that are null. This operator does not accept a value.IS_NOT_NULL: Selects values that are not null. This operator does not accept a value.LIKE: Selects values that match the specified pattern.NOT_LIKE: “Selects values that do not match the specified pattern.
String
The value to compare the column to.
[FilterInput!]
Additional filters to AND with this one. AND takes precedence over OR.
[FilterInput!]
Additional filters to OR with this one. AND takes precedence over OR.
Response
The counter response object. It contains a single Metric value for the given time range and Query Filters.String
The value of the counter.
QueryInfo
required
The Query statistics and metadata.
Show QueryInfo
Show QueryInfo
The Query Info object. It contains metadata and statistics about a Query performed.
ID
required
The Query’s unique identifier.
DateTime
required
The date and time in UTC when the Query was created.
String
required
The unique identifier of the actor that performed the Query.
DateTime
required
The date and time in UTC when the Query was last modified.
String
required
The unique identifier of the actor that modified the Query.
String
required
The bytes processed by the Query.
Int
required
The duration of the Query in milliseconds.
String
required
The number of records processed by the Query.
Int
required
The bytes returned by the Query.
Int
required
The number of records returned by the Query.
Propeller
The Propeller used for this query.
Show Propeller
Show Propeller
A Propeller determines your Application’s query processing power. The larger the Propeller, the faster the queries and the higher the cost. Every Propel Application (and therefore every set of API credentials) has a Propeller that determines the speed and cost of queries.
P1_X_SMALL: Max records per second: 5,000,000 records per secondP1_SMALL: Max records per second: 25,000,000 records per secondP1_MEDIUM: Max records per second: 100,000,000 records per secondP1_LARGE: Max records per second: 250,000,000 records per secondP1_X_LARGE: Max records per second: 500,000,000 records per second
QueryStatus
required
The Query status.
Show QueryStatus
Show QueryStatus
The Query status.
COMPLETED: The Query was completed succesfully.ERROR: The Query experienced an error.TIMED_OUT: The Query timed out.
QueryType
required
The Query type.
Show QueryType
Show QueryType
The Query type.
METRIC: Indicates a Metric Query.STATS: Indicates a Dimension Stats Query.REPORT: Indicates a Report Query.RECORDS: Indicates a Record Table Query.RECORDS_BY_UNIQUE_ID: Indicates records queried by unique ID.SQL: Indicates a SQL Query.TOP_VALUES: Indicates a Top Values Query.
QuerySubtype
The Query subtype.
Show QuerySubtype
Show QuerySubtype
The Query subtype.
COUNTER: Indicates a Metric counter Query.TIME_SERIES: Indicates a Metric time series Query.LEADERBOARD: Indicates a Metric leaderboard Query.
String
required
The SQL the query executed.
Embeddable UI components
Counter component
A React component to visualize a counter value.
useCounter
A React Hook for fetching a single aggregated value from the Counter API.