Documentation Index
Fetch the complete documentation index at: https://www.propeldata.com/llms.txt
Use this file to discover all available pages before exploring further.
Key concepts
- Metric type: Defines how the data is aggregated.
- Data Pool: The source of the data for the Metric.
- Dimensions: A set of columns used to categorize and segment the Metric data.
- Filters: A set of filters that define a subset of the Data Pool records to include in the Metric calculations.
Defining a Metric
This example shows how to create a Sum Metric to define a “Revenue” metric by summing the “total_price” column in the TacoSoft sample dataset.
This example shows the createSumMetric API mutation to define a “Revenue” metric by summing the “total_price” column in the TacoSoft sample dataset.mutation {
createSumMetric(input: {
dataPool: "DPOXXXXXXXXXXXXXX",
uniqueName: "Revenue",
dimensions: [
{
columnName: "restaurant_name"
}
],
measure: {
columnName: "taco_total_price"
}
}) {
metric {
id
uniqueName
}
}
}
resource "propel_metric" "revenue_metric" {
  unique_name = "Revenue"
  data_pool   = "DPOXXXXXXXXXXXXXX"

  type    = "SUM"
  measure = "taco_total_price"

  dimensions = ["restaurant_name"]
}
Examples
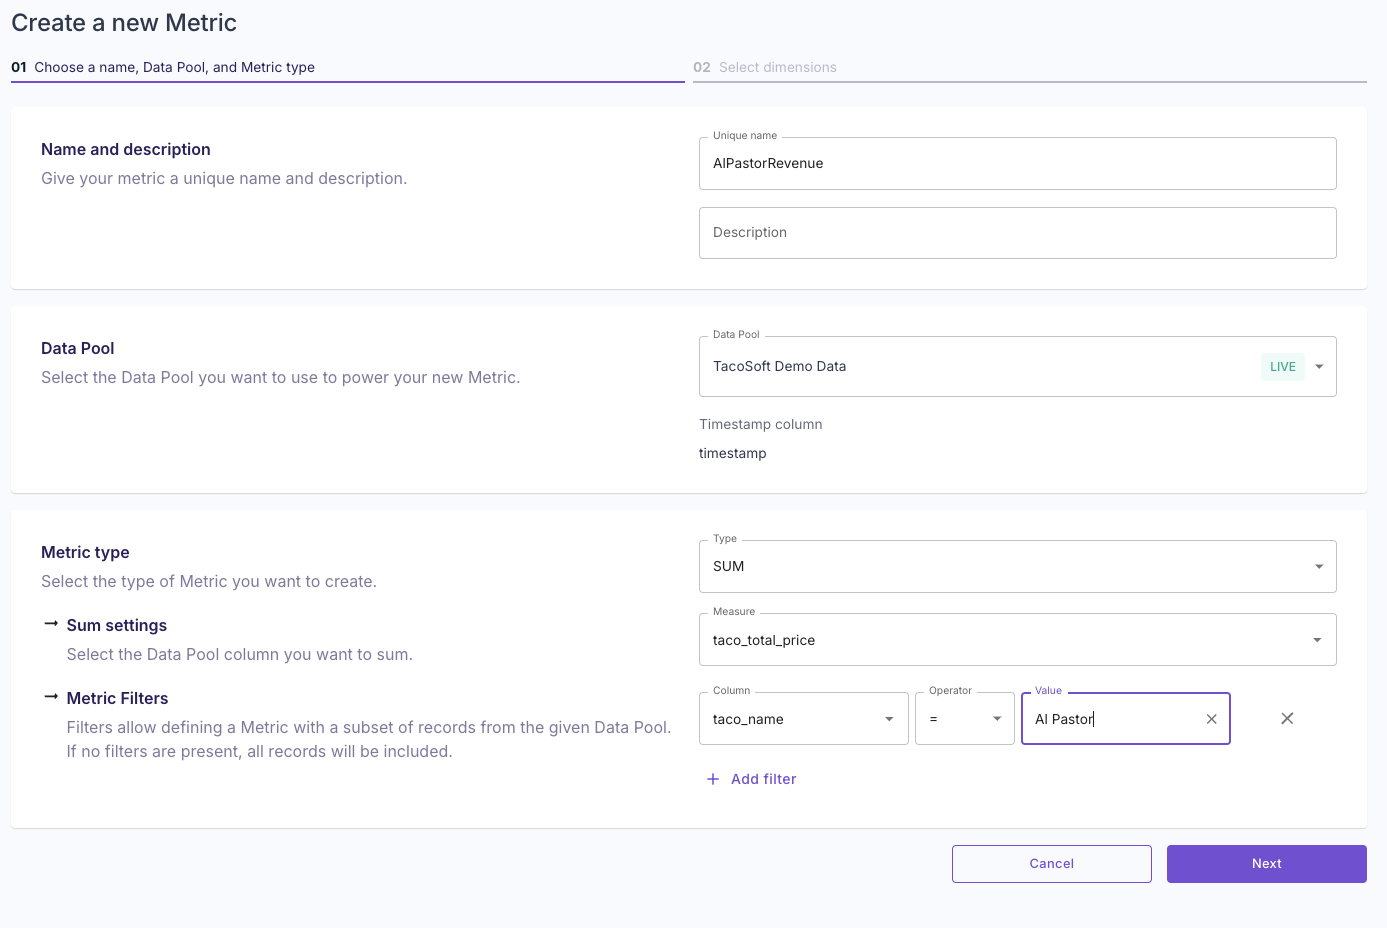
Example 1: Metrics with filters
This example shows how to create a Sum Metric with filters to define an “Al Pastor Revenue” metric by summing the “total_price” column for Al Pastor tacos in the TacoSoft sample dataset.
This example shows the createSumMetric API mutation to define a “Revenue” metric by summing the “total_price” column in the TacoSoft sample dataset with filters.mutation {
createSumMetric(input: {
dataPool: "DPOXXXXXXXXXXXXXX",
uniqueName: "AlPastorRevenue",
dimensions: [
{
columnName: "restaurant_name"
}
],
measure: {
columnName: "taco_total_price"
}
filterSql: "taco_name = 'Al Pastor'"
}) {
metric {
id
uniqueName
}
}
}
resource "propel_metric" "al_pastor_revenue" {
  unique_name = "AlPastorRevenue"
  data_pool   = "DPOXXXXXXXXXXXXXX"

  type    = "SUM"
  dimensions = ["restaurant_name"]
  measure = "taco_total_price"
  filter_sql = "taco_name = 'Al Pastor'"
}
Example 2: Metrics with JSON fields
You can use JSON values in the metric definition, either as a measure or as filters.
This example shows how to create a Sum Metric using a measure from a JSON column.
The following example demonstrates how to use the createSumMetric API mutation to define a “Revenue” metric. This metric sums the values located in a JSON column at the path: “OBJECT.order.total_price”.mutation {
createSumMetric(input: {
dataPool: "DPOXXXXXXXXXXXXXX",
uniqueName: "Revenue",
dimensions: [
{
columnName: "restaurant_name"
}
],
measure: {
columnName: "OBJECT.order.total_price"
}
}) {
metric {
id
uniqueName
}
}
}
resource "propel_metric" "revenue_metric" {
  unique_name = "Revenue"
  data_pool   = "DPOXXX"

  type    = "SUM"
  measure = "OBJECT.order.total_price"

  dimensions = ["Restaurant"]
}
Example 3: Custom Metrics
Custom Metrics use SQL expressions to aggregate data from your Data Pool, enabling more complex business logic.
This example shows how to create a Custom Metric for “Average revenue per order”.
The following example shows the query and input variables for the createCustomMetric API mutation to define an “Average revenue per order” metric with a custom expression.Querymutation {
createCustomMetric(input: {
dataPool: "DPOXXX",
uniqueName: "Average revenue per order",
filters: [
{
column: "ORDER_ID",
operator: "IS_NOT_NULL"
}
],
dimensions: [
{
columnName: "Restaurant"
}
],
expression: "SUM(total_price) / COUNT_DISTINCT(ORDER_ID)"
}) {
metric {
id
uniqueName
}
}
}
resource "propel_metric" "average_revenue_per_order" {
  unique_name = "Average revenue per order"
  data_pool   = "DPOXXX"
  dimensions = ["Restaurant"]
  expression = "SUM(total_price) / COUNT_DISTINCT(ORDER_ID)"
}